Sub-totals in a straight table
I ran into two different persons trying to add sub total into a straight table in Qlik Sense during the previous week. Sub totals is not a feature available in the standard Qlik Sense straight table so my first recommendation where to consider using a pivot table instead. However there is a way to create sub totals in a Qlik Sense or QlikView straight table. You will need adjust your data transactions or dimensions, here is how to do it.
PS: If you are just want to solve your sub total problem and are using QlikView then scroll down to the bottom of this blogpost to the Super Easy QlikView method.
The data set
The where an election for Swedish parlament September 9th 2018 and finally, on friday, the majority vote could agree on a candidate. For this post I’ll use parties seats in the Swedish parlament and their supported prime minister candidate.
Transactions:
LOAD * INLINE [
Parties,            Seats,  Supports
Socialdemokraterna, 100,    Stefan Lövén
Moderaterna,        70,     Ulf Kristersson
Sverigedemokraterna,62,     Ulf Kristersson
Centerpartiet,      31,     Stefan Lövén
Vänsterpartiet,     28,     Stefan Lövén
Kristdemokraterna,  22,     Ulf Kristersson
Liberalerna,        20,     Stefan Lövén
Miljöpartiet,       16,     Stefan Lövén
];
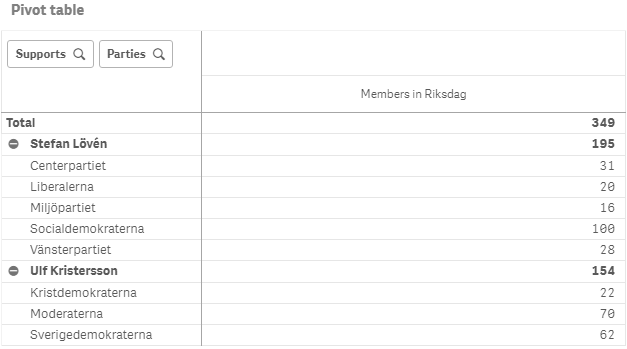
What I want to achieve is something similar to the Qlik Sense pivot table below, presenting toal seats in the Riksdag and sub totals with seats supporting each candidate
The sub total dimension
I'll guide you through two methods, the _sub total transaction dimension method_ and the _sub total dimension link method_. Common for the both is that you will create a field value "Sub Total" that is connected to a transaction amounts summing up to the correct sub total amounts.
The sub total transaction dimension
I the sub total transaction method you duplicate your transaction for all the values to be include ininto your sub total. At the same time you replace the detailed report row values to a static value e.g. 'Sub total'.
//The orignial transaction.
Load
	AutoNumber(Parties) as Sort,  //Added a Sort column for better layout handling
	Parties as [Report label], //This is my report riw
	[Seats],
	Supports
Resident Transactions
;

// Sub total transactions added to the transaction table.
Concatenate
Load
	AutoNumber('SubTotal') as Sort,
	'SubTotals' as [Report label],
	[Seats],
	Supports as Supports
Resident Transactions
;
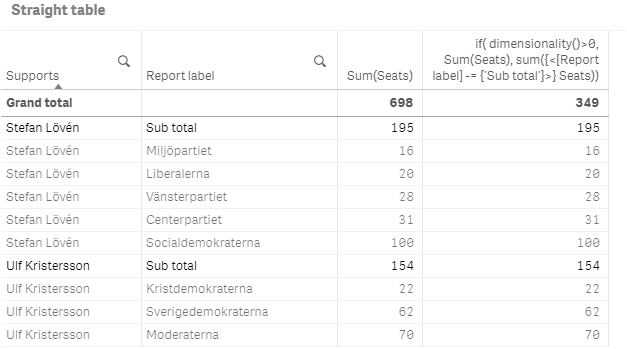
This scripting method is pretty easy to follow and understand when looking into the data set. By loading all [Report label] together with an aggregation function such as SUM([Seats]) you will get the correct values on all rows. Please note that since I duplicated the transactions amount the grand total will not be correct without adjustments to my expression.
 I need to handle the grand total seperatly because I’ve added extra transaction values to my transaction data table.
To get a correct grand total I either exclude (or explicit include) the 'Sub total' values from my expression using the following IF-statement.
if(   dimensionality()>0,
      Sum(Seats),  //Normal row
      sum({<[Report label] -= {'Sub totals'}>}  Seats) //Total row
   )
The obvious disadvantage of this method is the duplicated transactions that will trouble you when working with grand totals, KPIs etc., you can not aggregate without manipulating your selections with a set expression. The addition of transaction rows could also be an issue it it self, working with this method is not an excelent choice.
The sub total dimension link
The alternative of adding the sub totals straight into to transaction table is to break out the report label dimensions into a link table. Then let the link table reference each report lable to one or more transaction rows.
//Loads all transaction once,
[Transactions]:
  Load
      AutoNumber(Parties) as Sort,
      autonumber(Parties) as [%ReportLink],  //Key to the subtotal dimension link table
      Parties,
      [Seats],
      Supports
  Resident Transactions
  ;
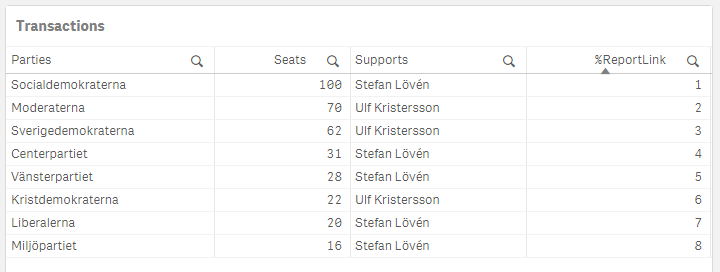 The Transaction output of the qlik script above
[Report labels]:
  LOAD distinct
  %ReportLink,
  [Parties] as [Report label]
  Resident [Transactions];

  Concatenate
  LOAD
  	[%ReportLink],
	'Sub total' as [Report label]

Resident [Transactions];
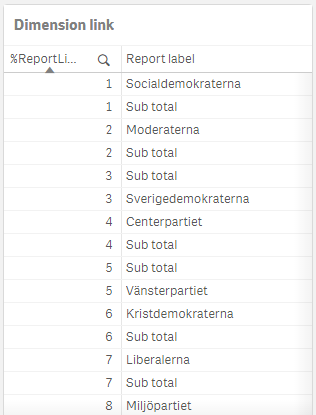 The dimension link table output of the script above the picture.
If selecting the "Socialdemokraterna" value in the report I only get the the data of the single transaction row in my calculations, but if I select "Sub totals" I get all transaction values without adding any new transaction rows. This will be even more beneficial in a scenario where I have multiple transaction rows per report label.
Since I have not added any new aggregated tranactions to my datamodel then sum(Seats) will be correct througout the application without any need of modifiers to my set. Consider the straight table below.
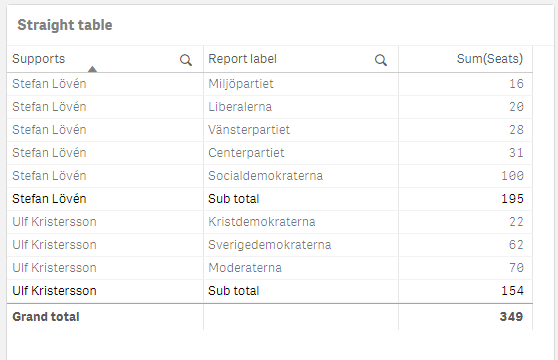
The sub total dimesion link method is not as obvious as the transaction dimension method, but it is more robust and expandable than duplicating transactions for every new multi row aggregation. This method is not only useful for creating sub totals, I often use this method when creating profit and loss statements where profits are defined to certain selections of accpunts and costs defined as another selection.
I made a Qlik Sense file, SubTotals in straight table.qvf, available for download from my Google drive if you're interrested.
The super easy QlikView method
If you are using QlikView there is a great alternative and super easy alternative to all the data modelling methods mentioned above.
- Load your transactions into the application
- Create a straight table with your dimensions and measure
- Select No totals in the Total mode for your expression
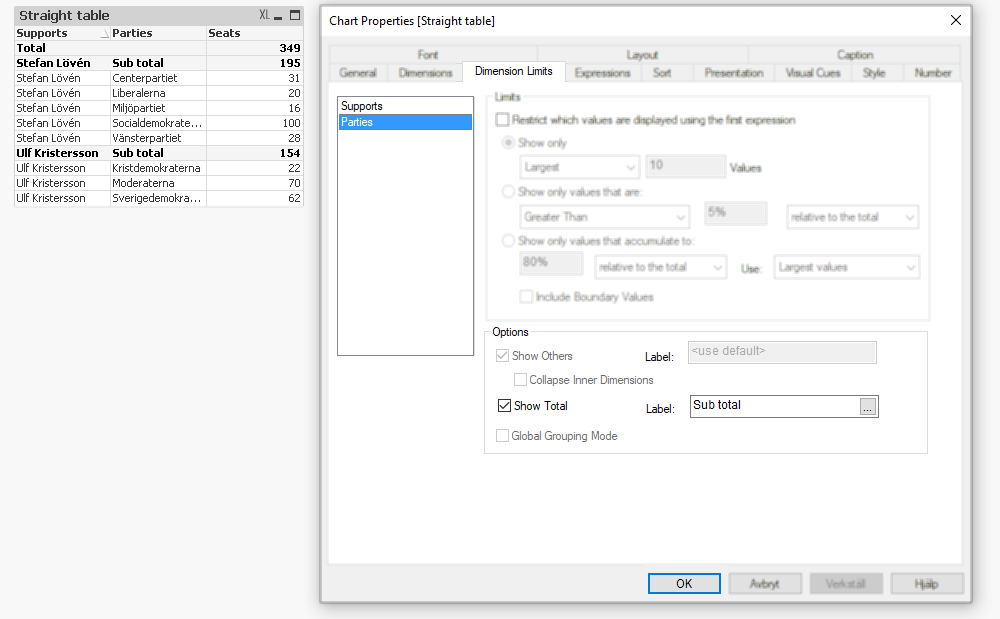
- Open Dimension Limits in your chart properties.
- Select the dimension for which you want to display sub totals and select Show Total under the Options section.
- Vioala! Your subtotals are ready.